Sales Summary
This guide explains the Sales Summary report of MyCloudBook: how to open it, how to see the sales by day, month, quarter, or year, which documents count, and how to print the report or download it as an Excel file.
Overview
The Sales Summary shows the sales of the company period by period: one row for each day, month, quarter, or year, and the total of the range. It answers questions such as "How much did we sell each month this year?" or "Which days of the week before the holiday were the busiest?".
MyCloudBook builds the report from the journal posts of the income accounts. A posted invoice or receipt adds its lines without sales tax on the date of the document, and a credit note lowers the sales on its own date. The payment of an invoice does not matter: an unpaid invoice is a sale of its date.
How to open the report
- In the left navigation, click Reports. The Reports tab lists the reports in four groups.
- In the group Sales Reports, double click Sales Summary.
- The report opens in its own tab and is created at once with the default settings. When the tab is open already, it becomes the active tab and keeps its settings.
A report tab can be closed with its x. The next double click opens the report again with the default settings.
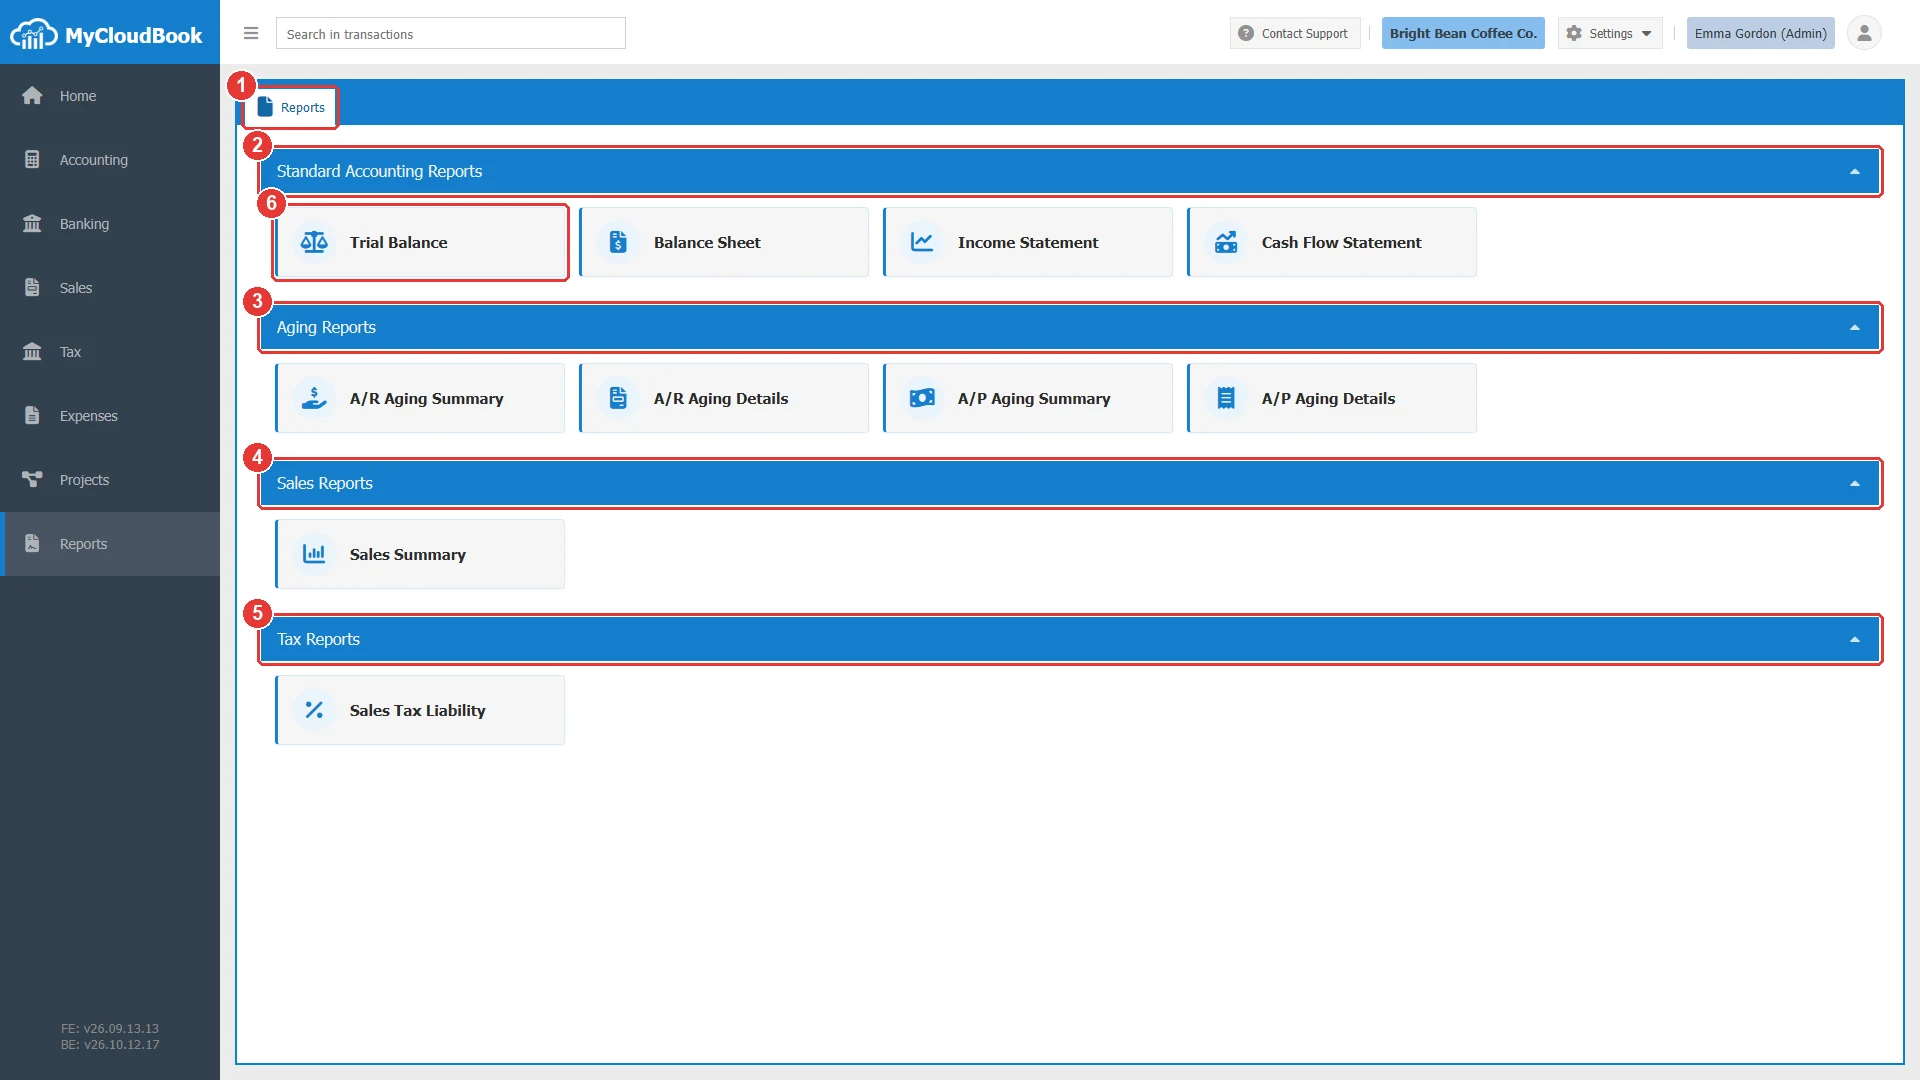
- 1The Reports tab. It is always the first tab of the Reports page.
- 2Standard Accounting Reports: Trial Balance, Balance Sheet, Income Statement, and Cash Flow Statement. A click on the title of a group hides or shows its reports.
- 3Aging Reports: A/R Aging Summary, A/R Aging Details, A/P Aging Summary, and A/P Aging Details.
- 4Sales Reports: Sales Summary.
- 5Tax Reports: Sales Tax Liability.
- 6A report, here Trial Balance. A double click opens it.
The report screen
The report screen has two parts. The center shows the report as a Portable Document Format (PDF) document in the PDF viewer of the browser. The Report Setting panel at the right holds the settings of the report. After a change of the settings, click Reload to create the report again. The arrow in the header of the panel hides the panel, so the report gets more room.
The report opens with the last thirteen months, one row for each month. The example shows the company Bright Bean Coffee Co., which started its sales in August 2026.
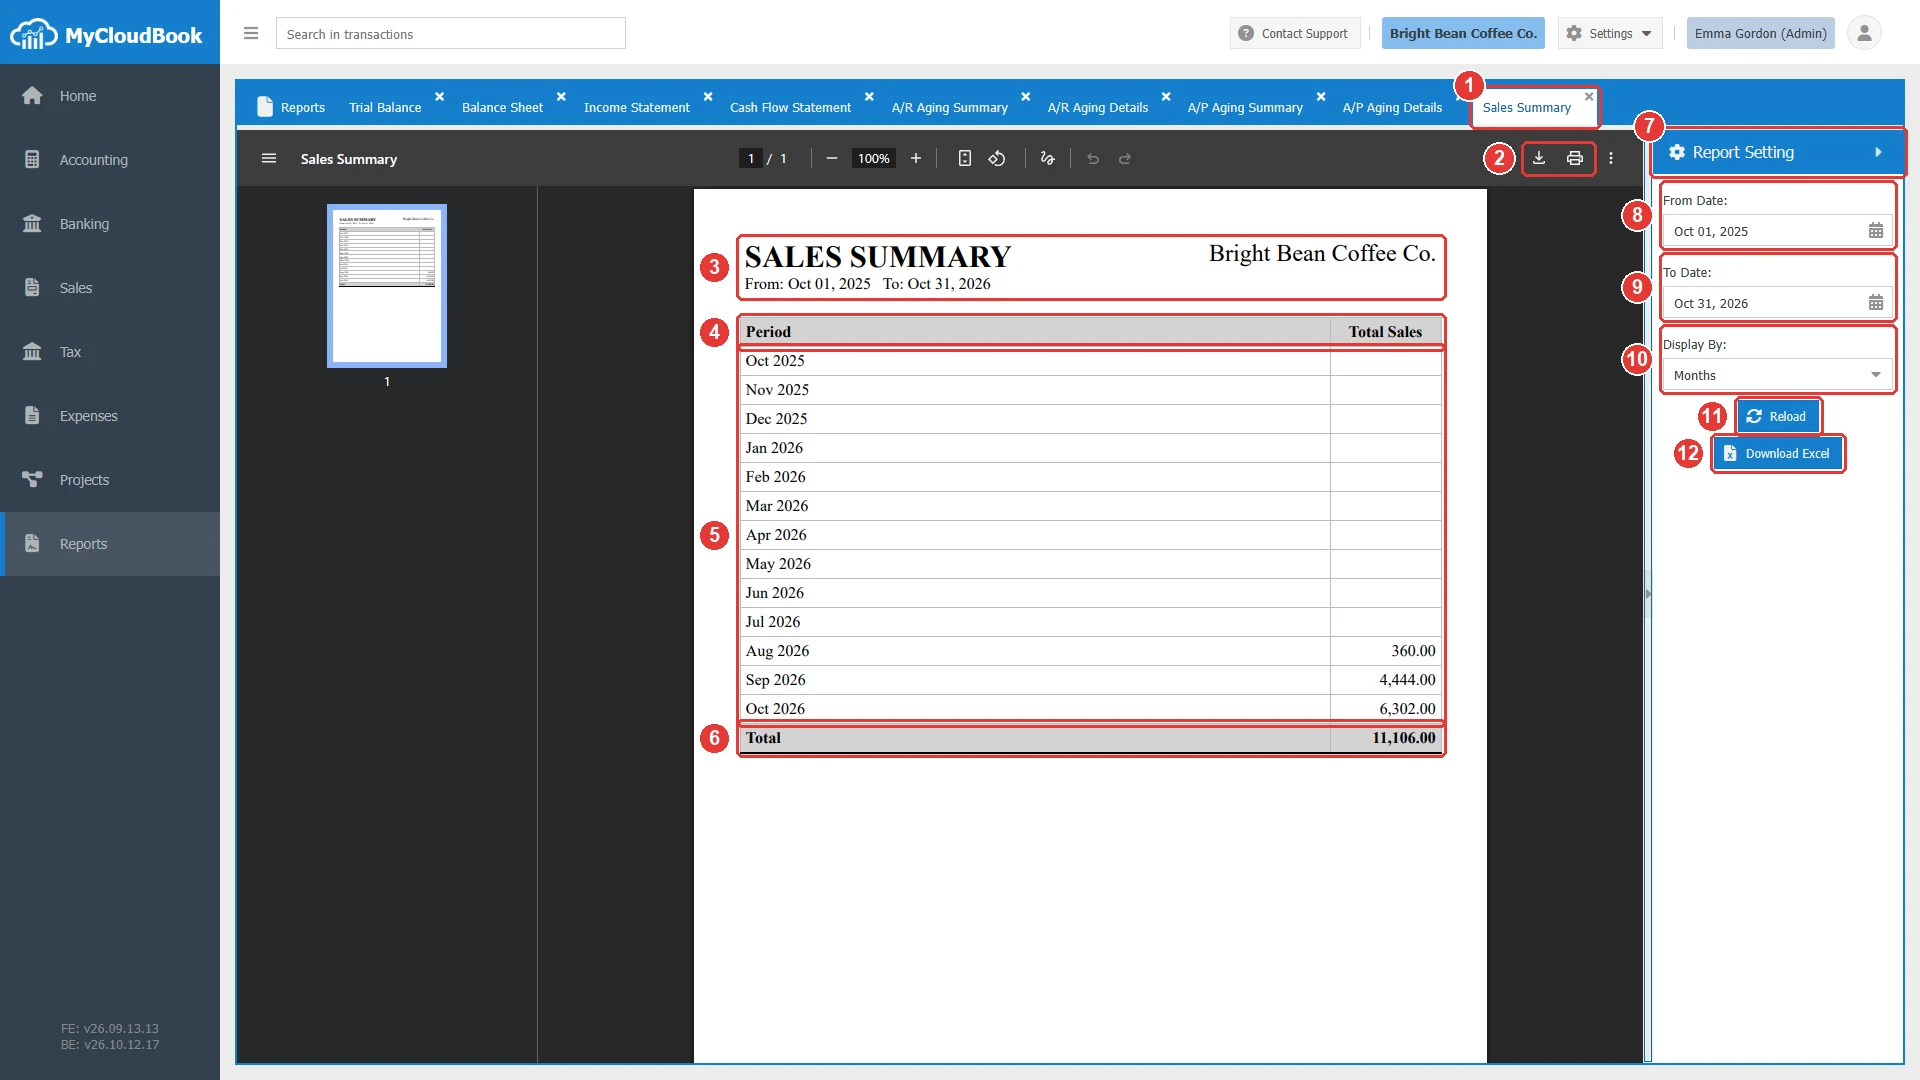
- 1The Sales Summary tab. The x closes it.
- 2The download and print buttons of the PDF viewer of the browser.
- 3The title of the report, SALES SUMMARY, the period, and the name of the company.
- 4The columns Period and Total Sales.
- 5One row for each period. A period without sales has an empty amount.
- 6Total. The sales of the whole range.
- 7Report Setting. The panel with the settings of the report.
- 8From Date. It starts with the first day of the current month one year ago.
- 9To Date. It starts with the last day of the current month.
- 10Display By. Total Only, Years, Quarters, Months (the default), or Days.
- 11Reload. Creates the report again with the settings of the panel.
- 12Download Excel. Downloads the report as the Excel file Sales Summary.xlsx.
The settings
| Field | Required | Purpose and rules |
|---|---|---|
| From Date | Required | The first day of the range. It must not be after the To Date. |
| To Date | Required | The last day of the range. Both dates are part of the range. |
| Display By | Required | The length of each row: Total Only (one row), Years, Quarters, Months, or Days. With Days the range can be up to 180 days long, and with Months up to 2 years. |
What the report counts
| Document | Effect on the Sales Summary |
|---|---|
| Invoice, receipt | Adds its lines without sales tax, on the date of the document. The payment status does not matter. |
| Credit note | Lowers the sales by its lines, on the date of the credit note. |
| Draft invoice, draft receipt | No effect until the draft is converted. |
| Estimate, sales order, project estimate | No effect. |
| Receipt voucher, refund voucher | No effect. A payment is not a sale. |
The report adds the posts of all income accounts of the company. Its total therefore equals the Total Income of the Income Statement for the same dates. The rows use the names of the calendar periods, for example Oct 2026 or Jul - Sep, 2026. A period that starts or ends inside a month is named with its two dates.
Sales by day
To see the sales of each day, set a short range and Display By Days. The example shows the first sixteen days of October 2026.
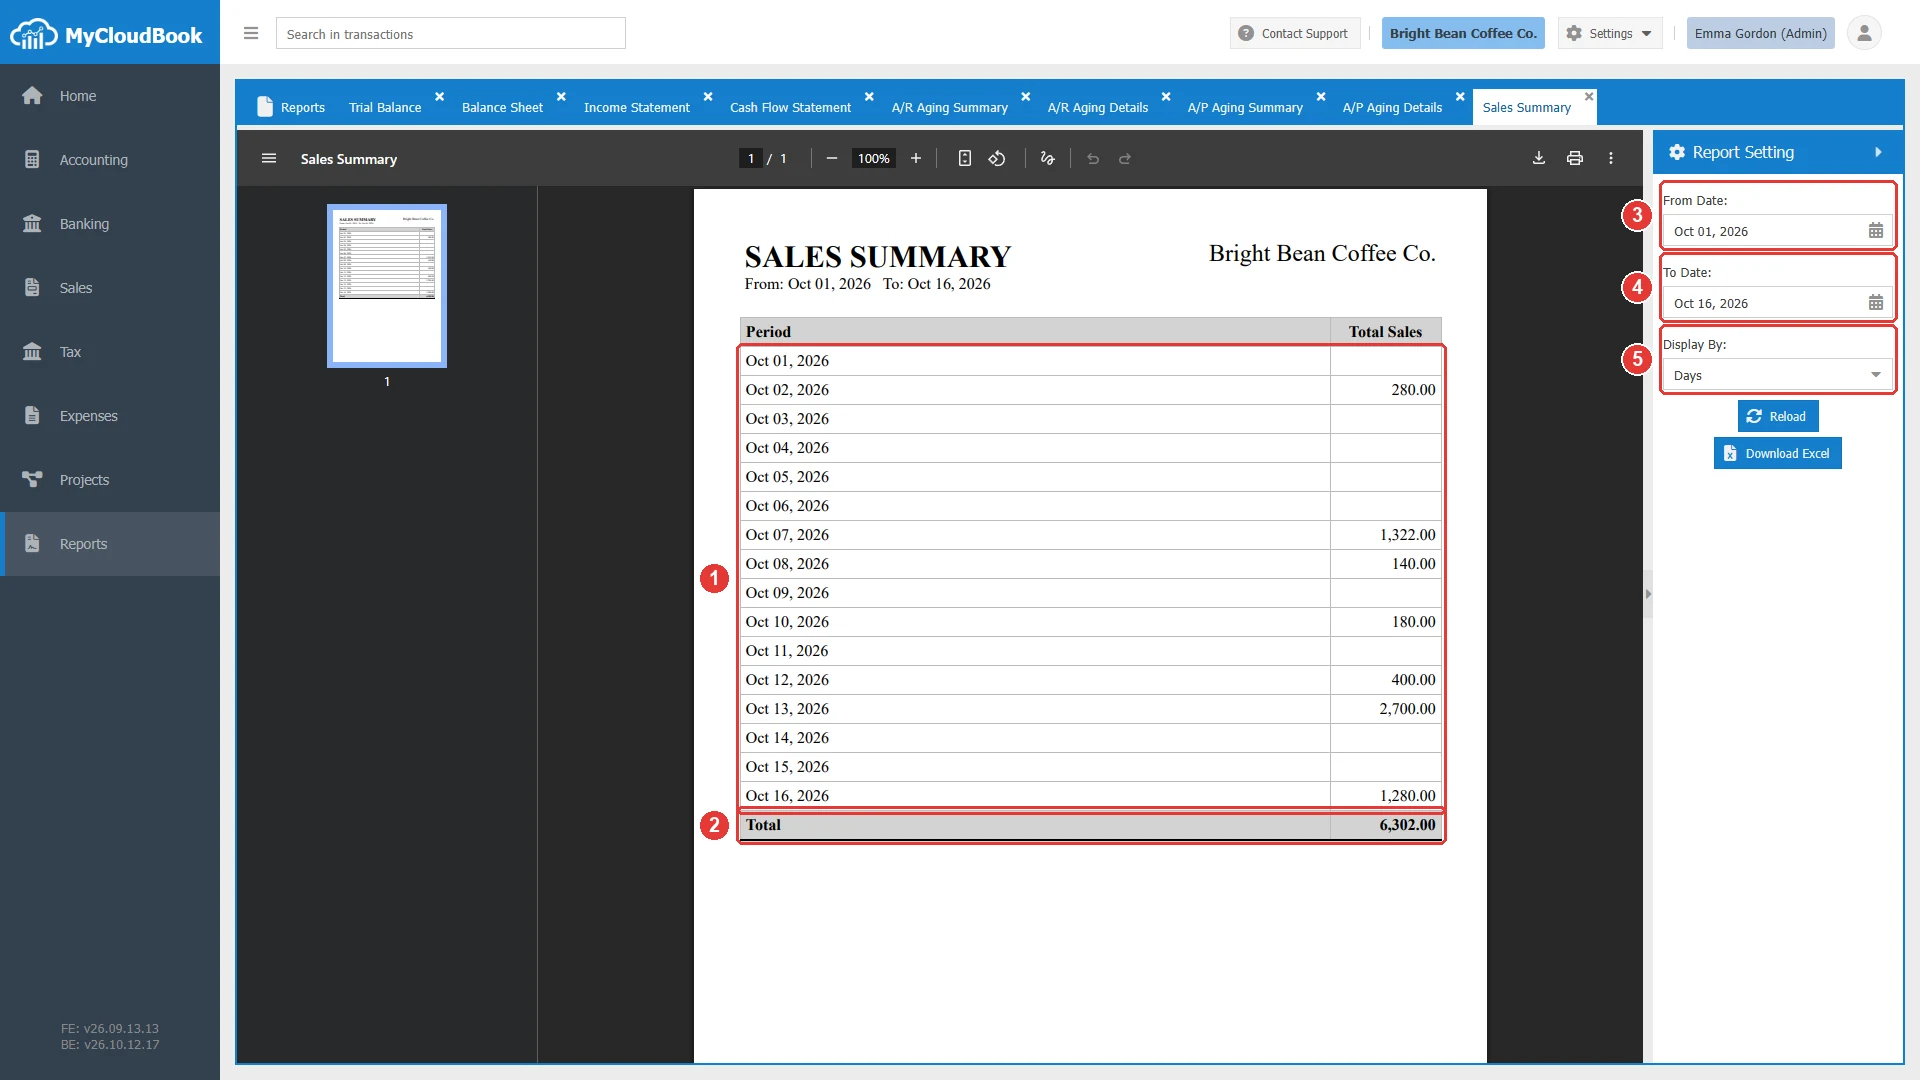
- 1One row for each day. October 13 was the best day with 2,700.00.
- 2Total. The sales of the sixteen days, 6,302.00.
- 3From Date. Oct 01, 2026.
- 4To Date. Oct 16, 2026.
- 5Display By. Days.
Printing and Excel
- To print the report, click the print button of the PDF viewer. To keep it as a PDF file, click the download button of the PDF viewer.
- To work with the figures in a spreadsheet, click Download Excel. MyCloudBook creates the report with the settings of the panel and downloads it as Sales Summary.xlsx. The Excel file has the same rows, a header that stays visible, and a print setup with page numbers.
- The report shows the posted data at the moment of the Reload. After new documents are saved, click Reload again.
Messages and their meaning
Questions and answers
Which documents does the Sales Summary count?
The posted invoices and receipts, without sales tax, on the date of each document. Credit notes lower the sales on their own date. Drafts, estimates, sales orders, and payments do not change the report.
Does an unpaid invoice count as a sale?
Yes. The report counts the invoice on its date, whether the customer has paid or not. The aging reports show what the customers still owe.
How do I see the sales of each day?
Set Display By to Days and choose a range of up to 180 days. The report then has one row for each day.
Why is the total equal to the Total Income of the Income Statement?
Both reports read the posts of the income accounts of the company for the same dates. The Sales Summary shows the total period by period, and the Income Statement shows it account by account.
Can I open the Sales Summary in Excel?
Yes. Click Download Excel. MyCloudBook downloads the report with the same settings as Sales Summary.xlsx.